本例子是MPAndroidChart官方最新的例子改装教程,这次官方的改动非常大,很多函数已经消失了,显示效率和开发效率都提升不少,API写的更加专业。笔记于:2017.09.25 例子的版本号:
android:versionCode="55"
    android:versionName="3.0.2"
之前做了一些带历史曲线的项目,用的是MPAndroidChart开源库(后面简称MP),现在需求历史曲线无数据部分不绘制。
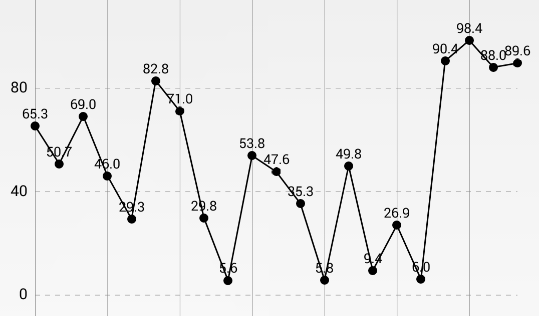
正常完整例子效果如下图所示:
直接用官方的例子改成非连续的数据源,代码如下:
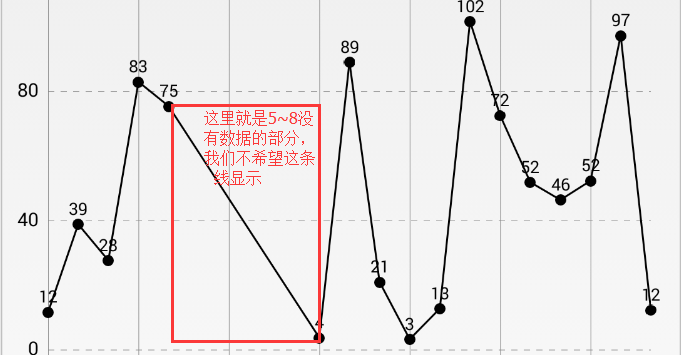
for (int i = 0; i < count; i++) {
float val = (float) (Math.random() * range) + 3;
if (i >= 5 && i <= 8)continue;
// values.add(new Entry(i, val,false));
// else
values.add(new Entry(i, val));
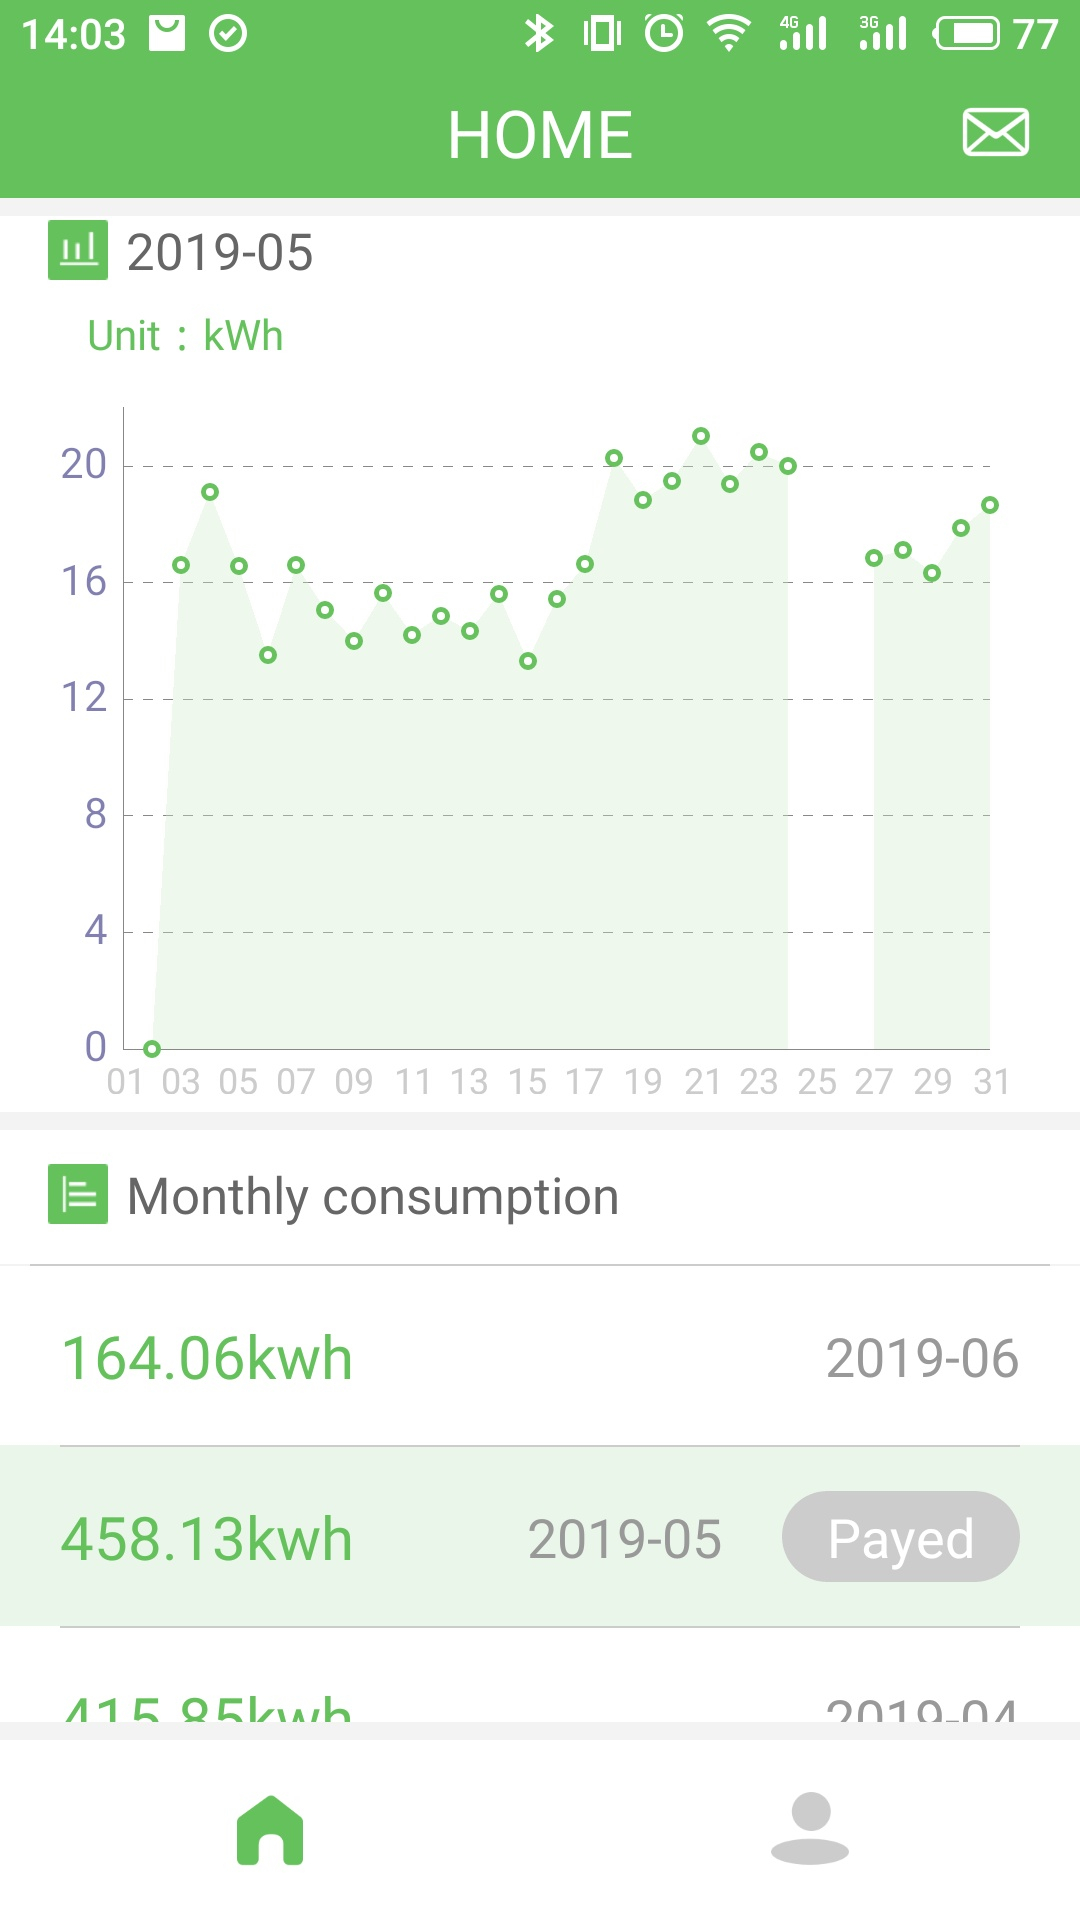
}屏蔽了5~8这4个节点的数据,再看看效果图:
这里需要改装代码,在BaseEntry添加一个boolean可视变量,部分源码如下:
    /** optional icon image */
    private Drawable mIcon = null;
    private boolean bVisible = true;
    public BaseEntry() {
    }
    public BaseEntry(float y) {
        this.y = y;
    }
    public BaseEntry(float y, Object data) {
        this(y);
        this.mData = data;
    }
    public BaseEntry(float y, Drawable icon) {
        this(y);
        this.mIcon = icon;
    }
    public BaseEntry(float y, Drawable icon, Object data) {
        this(y);
        this.mIcon = icon;
        this.mData = data;
    }
    public boolean isVisible() {
        return bVisible;
    }
    public void setVisible(boolean bVisible) {
        this.bVisible = bVisible;
    }
然后在Entry类中添加一个构造函数,如下:
    public Entry(float x, float y,boolean visible) {
        super(y);
        this.x = x;
        this.setVisible(visible);
    }
然后把例子中的代码改成以下代码段
for (int i = 0; i < count; i++) {
float val = (float) (Math.random() * range) + 3;
if (i >= 5 && i <= 8)
values.add(new Entry(i, val,false));
else
values.add(new Entry(i, val));
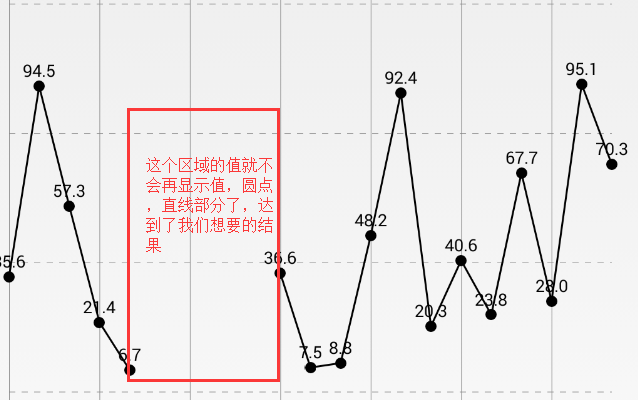
}此时,我们距离成功还差一步,就是不绘制不可见的点数据,圆圈,值,直接,这个要改装LineChartRenderer类,改的地方不是很多,我直接全部贴上源码
package com.github.mikephil.charting.renderer;
import android.graphics.Bitmap;
import android.graphics.Canvas;
import android.graphics.Color;
import android.graphics.Paint;
import android.graphics.Path;
import android.graphics.drawable.Drawable;
import com.github.mikephil.charting.animation.ChartAnimator;
import com.github.mikephil.charting.charts.LineChart;
import com.github.mikephil.charting.data.Entry;
import com.github.mikephil.charting.data.LineData;
import com.github.mikephil.charting.data.LineDataSet;
import com.github.mikephil.charting.highlight.Highlight;
import com.github.mikephil.charting.interfaces.dataprovider.LineDataProvider;
import com.github.mikephil.charting.interfaces.datasets.IDataSet;
import com.github.mikephil.charting.interfaces.datasets.ILineDataSet;
import com.github.mikephil.charting.utils.ColorTemplate;
import com.github.mikephil.charting.utils.MPPointD;
import com.github.mikephil.charting.utils.MPPointF;
import com.github.mikephil.charting.utils.Transformer;
import com.github.mikephil.charting.utils.Utils;
import com.github.mikephil.charting.utils.ViewPortHandler;
import java.lang.ref.WeakReference;
import java.util.HashMap;
import java.util.List;
public class LineChartRenderer extends LineRadarRenderer {
protected LineDataProvider mChart;
/**
* paint for the inner circle of the value indicators
*/
protected Paint mCirclePaintInner;
/**
* Bitmap object used for drawing the paths (otherwise they are too long if
* rendered directly on the canvas)
*/
protected WeakReference<Bitmap> mDrawBitmap;
/**
* on this canvas, the paths are rendered, it is initialized with the
* pathBitmap
*/
protected Canvas mBitmapCanvas;
/**
* the bitmap configuration to be used
*/
protected Bitmap.Config mBitmapConfig = Bitmap.Config.ARGB_8888;
protected Path cubicPath = new Path();
protected Path cubicFillPath = new Path();
public LineChartRenderer(LineDataProvider chart, ChartAnimator animator,
ViewPortHandler viewPortHandler) {
super(animator, viewPortHandler);
mChart = chart;
mCirclePaintInner = new Paint(Paint.ANTI_ALIAS_FLAG);
mCirclePaintInner.setStyle(Paint.Style.FILL);
mCirclePaintInner.setColor(Color.WHITE);
}
@Override
public void initBuffers() {
}
@Override
public void drawData(Canvas c) {
int width = (int) mViewPortHandler.getChartWidth();
int height = (int) mViewPortHandler.getChartHeight();
if (mDrawBitmap == null
|| (mDrawBitmap.get().getWidth() != width)
|| (mDrawBitmap.get().getHeight() != height)) {
if (width > 0 && height > 0) {
mDrawBitmap = new WeakReference<Bitmap>(Bitmap.createBitmap(width, height, mBitmapConfig));
mBitmapCanvas = new Canvas(mDrawBitmap.get());
} else
return;
}
mDrawBitmap.get().eraseColor(Color.TRANSPARENT);
LineData lineData = mChart.getLineData();
for (ILineDataSet set : lineData.getDataSets()) {
if (set.isVisible())
drawDataSet(c, set);
}
c.drawBitmap(mDrawBitmap.get(), 0, 0, mRenderPaint);
}
protected void drawDataSet(Canvas c, ILineDataSet dataSet) {
if (dataSet.getEntryCount() < 1)
return;
mRenderPaint.setStrokeWidth(dataSet.getLineWidth());
mRenderPaint.setPathEffect(dataSet.getDashPathEffect());
switch (dataSet.getMode()) {
default:
case LINEAR:
case STEPPED:
drawLinear(c, dataSet);
break;
case CUBIC_BEZIER:
drawCubicBezier(dataSet);
break;
case HORIZONTAL_BEZIER:
drawHorizontalBezier(dataSet);
break;
}
mRenderPaint.setPathEffect(null);
}
protected void drawHorizontalBezier(ILineDataSet dataSet) {
float phaseY = mAnimator.getPhaseY();
Transformer trans = mChart.getTransformer(dataSet.getAxisDependency());
mXBounds.set(mChart, dataSet);
cubicPath.reset();
if (mXBounds.range >= 1) {
Entry prev = dataSet.getEntryForIndex(mXBounds.min);
Entry cur = prev;
// let the spline start
cubicPath.moveTo(cur.getX(), cur.getY() * phaseY);
for (int j = mXBounds.min + 1; j <= mXBounds.range + mXBounds.min; j++) {
prev = cur;
cur = dataSet.getEntryForIndex(j);
final float cpx = (prev.getX())
+ (cur.getX() - prev.getX()) / 2.0f;
cubicPath.cubicTo(
cpx, prev.getY() * phaseY,
cpx, cur.getY() * phaseY,
cur.getX(), cur.getY() * phaseY);
}
}
// if filled is enabled, close the path
if (dataSet.isDrawFilledEnabled()) {
cubicFillPath.reset();
cubicFillPath.addPath(cubicPath);
// create a new path, this is bad for performance
drawCubicFill(mBitmapCanvas, dataSet, cubicFillPath, trans, mXBounds);
}
mRenderPaint.setColor(dataSet.getColor());
mRenderPaint.setStyle(Paint.Style.STROKE);
trans.pathValueToPixel(cubicPath);
mBitmapCanvas.drawPath(cubicPath, mRenderPaint);
mRenderPaint.setPathEffect(null);
}
protected void drawCubicBezier(ILineDataSet dataSet) {
float phaseX = Math.max(0.f, Math.min(1.f, mAnimator.getPhaseX()));
float phaseY = mAnimator.getPhaseY();
Transformer trans = mChart.getTransformer(dataSet.getAxisDependency());
mXBounds.set(mChart, dataSet);
float intensity = dataSet.getCubicIntensity();
cubicPath.reset();
if (mXBounds.range >= 1) {
float prevDx = 0f;
float prevDy = 0f;
float curDx = 0f;
float curDy = 0f;
// Take an extra point from the left, and an extra from the right.
// That's because we need 4 points for a cubic bezier (cubic=4), otherwise we get lines moving and doing weird stuff on the edges of the chart.
// So in the starting `prev` and `cur`, go -2, -1
// And in the `lastIndex`, add +1
final int firstIndex = mXBounds.min + 1;
final int lastIndex = mXBounds.min + mXBounds.range;
Entry prevPrev;
Entry prev = dataSet.getEntryForIndex(Math.max(firstIndex - 2, 0));
Entry cur = dataSet.getEntryForIndex(Math.max(firstIndex - 1, 0));
Entry next = cur;
int nextIndex = -1;
if (cur == null) return;
// let the spline start
cubicPath.moveTo(cur.getX(), cur.getY() * phaseY);
for (int j = mXBounds.min + 1; j <= mXBounds.range + mXBounds.min; j++) {
prevPrev = prev;
prev = cur;
cur = nextIndex == j ? next : dataSet.getEntryForIndex(j);
nextIndex = j + 1 < dataSet.getEntryCount() ? j + 1 : j;
next = dataSet.getEntryForIndex(nextIndex);
prevDx = (cur.getX() - prevPrev.getX()) * intensity;
prevDy = (cur.getY() - prevPrev.getY()) * intensity;
curDx = (next.getX() - prev.getX()) * intensity;
curDy = (next.getY() - prev.getY()) * intensity;
cubicPath.cubicTo(prev.getX() + prevDx, (prev.getY() + prevDy) * phaseY,
cur.getX() - curDx,
(cur.getY() - curDy) * phaseY, cur.getX(), cur.getY() * phaseY);
}
}
// if filled is enabled, close the path
if (dataSet.isDrawFilledEnabled()) {
cubicFillPath.reset();
cubicFillPath.addPath(cubicPath);
drawCubicFill(mBitmapCanvas, dataSet, cubicFillPath, trans, mXBounds);
}
mRenderPaint.setColor(dataSet.getColor());
mRenderPaint.setStyle(Paint.Style.STROKE);
trans.pathValueToPixel(cubicPath);
mBitmapCanvas.drawPath(cubicPath, mRenderPaint);
mRenderPaint.setPathEffect(null);
}
protected void drawCubicFill(Canvas c, ILineDataSet dataSet, Path spline, Transformer trans, XBounds bounds) {
float fillMin = dataSet.getFillFormatter()
.getFillLinePosition(dataSet, mChart);
spline.lineTo(dataSet.getEntryForIndex(bounds.min + bounds.range).getX(), fillMin);
spline.lineTo(dataSet.getEntryForIndex(bounds.min).getX(), fillMin);
spline.close();
trans.pathValueToPixel(spline);
final Drawable drawable = dataSet.getFillDrawable();
if (drawable != null) {
drawFilledPath(c, spline, drawable);
} else {
drawFilledPath(c, spline, dataSet.getFillColor(), dataSet.getFillAlpha());
}
}
private float[] mLineBuffer = new float[4];
/**
* Draws a normal line.
*
* @param c
* @param dataSet
*/
protected void drawLinear(Canvas c, ILineDataSet dataSet) {
int entryCount = dataSet.getEntryCount();
final boolean isDrawSteppedEnabled = dataSet.isDrawSteppedEnabled();
final int pointsPerEntryPair = isDrawSteppedEnabled ? 4 : 2;
Transformer trans = mChart.getTransformer(dataSet.getAxisDependency());
float phaseY = mAnimator.getPhaseY();
mRenderPaint.setStyle(Paint.Style.STROKE);
Canvas canvas = null;
// if the data-set is dashed, draw on bitmap-canvas
if (dataSet.isDashedLineEnabled()) {
canvas = mBitmapCanvas;
} else {
canvas = c;
}
mXBounds.set(mChart, dataSet);
// if drawing filled is enabled
if (dataSet.isDrawFilledEnabled() && entryCount > 0) {
drawLinearFill(c, dataSet, trans, mXBounds);
}
// more than 1 color
if (dataSet.getColors().size() > 1) {
if (mLineBuffer.length <= pointsPerEntryPair * 2)
mLineBuffer = new float[pointsPerEntryPair * 4];
for (int j = mXBounds.min; j <= mXBounds.range + mXBounds.min; j++) {
Entry e = dataSet.getEntryForIndex(j);
if (e == null) continue;
mLineBuffer[0] = e.getX();
mLineBuffer[1] = e.getY() * phaseY;
if (j < mXBounds.max) {
e = dataSet.getEntryForIndex(j + 1);
if (e == null) break;
if (isDrawSteppedEnabled) {
mLineBuffer[2] = e.getX();
mLineBuffer[3] = mLineBuffer[1];
mLineBuffer[4] = mLineBuffer[2];
mLineBuffer[5] = mLineBuffer[3];
mLineBuffer[6] = e.getX();
mLineBuffer[7] = e.getY() * phaseY;
} else {
mLineBuffer[2] = e.getX();
mLineBuffer[3] = e.getY() * phaseY;
}
} else {
mLineBuffer[2] = mLineBuffer[0];
mLineBuffer[3] = mLineBuffer[1];
}
trans.pointValuesToPixel(mLineBuffer);
if (!mViewPortHandler.isInBoundsRight(mLineBuffer[0]))
break;
// make sure the lines don't do shitty things outside
// bounds
if (!mViewPortHandler.isInBoundsLeft(mLineBuffer[2])
|| (!mViewPortHandler.isInBoundsTop(mLineBuffer[1]) && !mViewPortHandler
.isInBoundsBottom(mLineBuffer[3])))
continue;
// get the color that is set for this line-segment
mRenderPaint.setColor(dataSet.getColor(j));
canvas.drawLines(mLineBuffer, 0, pointsPerEntryPair * 2, mRenderPaint);
}
} else { // only one color per dataset
if (mLineBuffer.length < Math.max((entryCount) * pointsPerEntryPair, pointsPerEntryPair) * 2)
mLineBuffer = new float[Math.max((entryCount) * pointsPerEntryPair, pointsPerEntryPair) * 4];
Entry e1, e2;
e1 = dataSet.getEntryForIndex(mXBounds.min);
if (e1 != null) {
int j = 0;
for (int x = mXBounds.min; x <= mXBounds.range + mXBounds.min; x++) {
e1 = dataSet.getEntryForIndex(x == 0 ? 0 : (x - 1));
e2 = dataSet.getEntryForIndex(x);
if (e1.isVisible() && e2.isVisible()) {
mLineBuffer[j++] = e1.getX();
mLineBuffer[j++] = e1.getY() * phaseY;
if (isDrawSteppedEnabled) {
mLineBuffer[j++] = e2.getX();
mLineBuffer[j++] = e1.getY() * phaseY;
mLineBuffer[j++] = e2.getX();
mLineBuffer[j++] = e1.getY() * phaseY;
}
mLineBuffer[j++] = e2.getX();
mLineBuffer[j++] = e2.getY() * phaseY;
}
}
if (j > 0) {
trans.pointValuesToPixel(mLineBuffer);
final int size = Math.max((mXBounds.range + 1) * pointsPerEntryPair, pointsPerEntryPair) * 2;
mRenderPaint.setColor(dataSet.getColor());
canvas.drawLines(mLineBuffer, 0, size, mRenderPaint);
}
}
}
mRenderPaint.setPathEffect(null);
}
protected Path mGenerateFilledPathBuffer = new Path();
/**
* Draws a filled linear path on the canvas.
*
* @param c
* @param dataSet
* @param trans
* @param bounds
*/
protected void drawLinearFill(Canvas c, ILineDataSet dataSet, Transformer trans, XBounds bounds) {
final Path filled = mGenerateFilledPathBuffer;
final int startingIndex = bounds.min;
final int endingIndex = bounds.range + bounds.min;
final int indexInterval = 128;
int currentStartIndex = 0;
int currentEndIndex = indexInterval;
int iterations = 0;
// Doing this iteratively in order to avoid OutOfMemory errors that can happen on large bounds sets.
do {
currentStartIndex = startingIndex + (iterations * indexInterval);
currentEndIndex = currentStartIndex + indexInterval;
currentEndIndex = currentEndIndex > endingIndex ? endingIndex : currentEndIndex;
if (currentStartIndex <= currentEndIndex) {
generateFilledPath(dataSet, currentStartIndex, currentEndIndex, filled);
trans.pathValueToPixel(filled);
final Drawable drawable = dataSet.getFillDrawable();
if (drawable != null) {
drawFilledPath(c, filled, drawable);
} else {
drawFilledPath(c, filled, dataSet.getFillColor(), dataSet.getFillAlpha());
}
}
iterations++;
} while (currentStartIndex <= currentEndIndex);
}
/**
* Generates a path that is used for filled drawing.
*
* @param dataSet The dataset from which to read the entries.
* @param startIndex The index from which to start reading the dataset
* @param endIndex The index from which to stop reading the dataset
* @param outputPath The path object that will be assigned the chart data.
* @return
*/
private void generateFilledPath(final ILineDataSet dataSet, final int startIndex, final int endIndex, final Path outputPath) {
final float fillMin = dataSet.getFillFormatter().getFillLinePosition(dataSet, mChart);
final float phaseY = mAnimator.getPhaseY();
final boolean isDrawSteppedEnabled = dataSet.getMode() == LineDataSet.Mode.STEPPED;
final Path filled = outputPath;
filled.reset();
final Entry entry = dataSet.getEntryForIndex(startIndex);
boolean drawFirst = false;
if (entry.isVisible()) {
drawFirst = true;
filled.moveTo(entry.getX(), fillMin);
filled.lineTo(entry.getX(), entry.getY() * phaseY);
}
// create a new path
Entry currentEntry = null;
Entry previousEntry = entry;
boolean closed = false;
for (int x = startIndex + 1; x <= endIndex; x++) {
currentEntry = dataSet.getEntryForIndex(x);
if (!currentEntry.isVisible()) {//不可见时,闭合路径
if (closed || !drawFirst) continue;
filled.lineTo(previousEntry.getX(), fillMin);
filled.close();
//filled.reset();
closed = true;
continue;
} else if (closed) {
filled.moveTo(currentEntry.getX(), fillMin);
closed = false;
}
if (isDrawSteppedEnabled && previousEntry != null) {
filled.lineTo(currentEntry.getX(), previousEntry.getY() * phaseY);
}
if (drawFirst)
filled.lineTo(currentEntry.getX(), currentEntry.getY() * phaseY);
else {
drawFirst = true;
filled.moveTo(currentEntry.getX(), fillMin);
filled.lineTo(currentEntry.getX(), currentEntry.getY() * phaseY);
}
previousEntry = currentEntry;
}
// close up
if (currentEntry != null) {
filled.lineTo(currentEntry.getX(), fillMin);
}
filled.close();
}
@Override
public void drawValues(Canvas c) {
if (isDrawingValuesAllowed(mChart)) {
List<ILineDataSet> dataSets = mChart.getLineData().getDataSets();
for (int i = 0; i < dataSets.size(); i++) {
ILineDataSet dataSet = dataSets.get(i);
if (!shouldDrawValues(dataSet))
continue;
// apply the text-styling defined by the DataSet
applyValueTextStyle(dataSet);
Transformer trans = mChart.getTransformer(dataSet.getAxisDependency());
// make sure the values do not interfear with the circles
int valOffset = (int) (dataSet.getCircleRadius() * 1.75f);
if (!dataSet.isDrawCirclesEnabled())
valOffset = valOffset / 2;
mXBounds.set(mChart, dataSet);
float[] positions = trans.generateTransformedValuesLine(dataSet, mAnimator.getPhaseX(), mAnimator
.getPhaseY(), mXBounds.min, mXBounds.max);
MPPointF iconsOffset = MPPointF.getInstance(dataSet.getIconsOffset());
iconsOffset.x = Utils.convertDpToPixel(iconsOffset.x);
iconsOffset.y = Utils.convertDpToPixel(iconsOffset.y);
for (int j = 0; j < positions.length; j += 2) {
float x = positions[j];
float y = positions[j + 1];
if (!mViewPortHandler.isInBoundsRight(x))
break;
if (!mViewPortHandler.isInBoundsLeft(x) || !mViewPortHandler.isInBoundsY(y))
continue;
Entry entry = dataSet.getEntryForIndex(j / 2 + mXBounds.min);
if (!entry.isVisible()) continue;
if (dataSet.isDrawValuesEnabled()) {
drawValue(c, dataSet.getValueFormatter(), entry.getY(), entry, i, x,
y - valOffset, dataSet.getValueTextColor(j / 2));
}
if (entry.getIcon() != null && dataSet.isDrawIconsEnabled()) {
Drawable icon = entry.getIcon();
Utils.drawImage(
c,
icon,
(int) (x + iconsOffset.x),
(int) (y + iconsOffset.y),
icon.getIntrinsicWidth(),
icon.getIntrinsicHeight());
}
}
MPPointF.recycleInstance(iconsOffset);
}
}
}
@Override
public void drawExtras(Canvas c) {
drawCircles(c);
}
/**
* cache for the circle bitmaps of all datasets
*/
private HashMap<IDataSet, DataSetImageCache> mImageCaches = new HashMap<>();
/**
* buffer for drawing the circles
*/
private float[] mCirclesBuffer = new float[2];
protected void drawCircles(Canvas c) {
mRenderPaint.setStyle(Paint.Style.FILL);
float phaseY = mAnimator.getPhaseY();
mCirclesBuffer[0] = 0;
mCirclesBuffer[1] = 0;
List<ILineDataSet> dataSets = mChart.getLineData().getDataSets();
for (int i = 0; i < dataSets.size(); i++) {
ILineDataSet dataSet = dataSets.get(i);
if (!dataSet.isVisible() || !dataSet.isDrawCirclesEnabled() ||
dataSet.getEntryCount() == 0)
continue;
mCirclePaintInner.setColor(dataSet.getCircleHoleColor());
Transformer trans = mChart.getTransformer(dataSet.getAxisDependency());
mXBounds.set(mChart, dataSet);
float circleRadius = dataSet.getCircleRadius();
float circleHoleRadius = dataSet.getCircleHoleRadius();
boolean drawCircleHole = dataSet.isDrawCircleHoleEnabled() &&
circleHoleRadius < circleRadius &&
circleHoleRadius > 0.f;
boolean drawTransparentCircleHole = drawCircleHole &&
dataSet.getCircleHoleColor() == ColorTemplate.COLOR_NONE;
DataSetImageCache imageCache;
if (mImageCaches.containsKey(dataSet)) {
imageCache = mImageCaches.get(dataSet);
} else {
imageCache = new DataSetImageCache();
mImageCaches.put(dataSet, imageCache);
}
boolean changeRequired = imageCache.init(dataSet);
// only fill the cache with new bitmaps if a change is required
if (changeRequired) {
imageCache.fill(dataSet, drawCircleHole, drawTransparentCircleHole);
}
int boundsRangeCount = mXBounds.range + mXBounds.min;
for (int j = mXBounds.min; j <= boundsRangeCount; j++) {
Entry e = dataSet.getEntryForIndex(j);
if (e == null) break;
if (!e.isVisible()) continue;
mCirclesBuffer[0] = e.getX();
mCirclesBuffer[1] = e.getY() * phaseY;
trans.pointValuesToPixel(mCirclesBuffer);
if (!mViewPortHandler.isInBoundsRight(mCirclesBuffer[0]))
break;
if (!mViewPortHandler.isInBoundsLeft(mCirclesBuffer[0]) ||
!mViewPortHandler.isInBoundsY(mCirclesBuffer[1]))
continue;
Bitmap circleBitmap = imageCache.getBitmap(j);
if (circleBitmap != null) {
c.drawBitmap(circleBitmap, mCirclesBuffer[0] - circleRadius, mCirclesBuffer[1] - circleRadius, null);
}
}
}
}
@Override
public void drawHighlighted(Canvas c, Highlight[] indices) {
LineData lineData = mChart.getLineData();
for (Highlight high : indices) {
ILineDataSet set = lineData.getDataSetByIndex(high.getDataSetIndex());
if (set == null || !set.isHighlightEnabled())
continue;
Entry e = set.getEntryForXValue(high.getX(), high.getY());
if (!isInBoundsX(e, set) || !e.isVisible())
continue;
MPPointD pix = mChart.getTransformer(set.getAxisDependency()).getPixelForValues(e.getX(), e.getY() * mAnimator
.getPhaseY());
high.setDraw((float) pix.x, (float) pix.y);
// draw the lines
drawHighlightLines(c, (float) pix.x, (float) pix.y, set);
}
}
/**
* Sets the Bitmap.Config to be used by this renderer.
* Default: Bitmap.Config.ARGB_8888
* Use Bitmap.Config.ARGB_4444 to consume less memory.
*
* @param config
*/
public void setBitmapConfig(Bitmap.Config config) {
mBitmapConfig = config;
releaseBitmap();
}
/**
* Returns the Bitmap.Config that is used by this renderer.
*
* @return
*/
public Bitmap.Config getBitmapConfig() {
return mBitmapConfig;
}
/**
* Releases the drawing bitmap. This should be called when {@link LineChart#onDetachedFromWindow()}.
*/
public void releaseBitmap() {
if (mBitmapCanvas != null) {
mBitmapCanvas.setBitmap(null);
mBitmapCanvas = null;
}
if (mDrawBitmap != null) {
mDrawBitmap.get().recycle();
mDrawBitmap.clear();
mDrawBitmap = null;
}
}
private class DataSetImageCache {
private Path mCirclePathBuffer = new Path();
private Bitmap[] circleBitmaps;
/**
* Sets up the cache, returns true if a change of cache was required.
*
* @param set
* @return
*/
protected boolean init(ILineDataSet set) {
int size = set.getCircleColorCount();
boolean changeRequired = false;
if (circleBitmaps == null) {
circleBitmaps = new Bitmap[size];
changeRequired = true;
} else if (circleBitmaps.length != size) {
circleBitmaps = new Bitmap[size];
changeRequired = true;
}
return changeRequired;
}
/**
* Fills the cache with bitmaps for the given dataset.
*
* @param set
* @param drawCircleHole
* @param drawTransparentCircleHole
*/
protected void fill(ILineDataSet set, boolean drawCircleHole, boolean drawTransparentCircleHole) {
int colorCount = set.getCircleColorCount();
float circleRadius = set.getCircleRadius();
float circleHoleRadius = set.getCircleHoleRadius();
for (int i = 0; i < colorCount; i++) {
Bitmap.Config conf = Bitmap.Config.ARGB_4444;
Bitmap circleBitmap = Bitmap.createBitmap((int) (circleRadius * 2.1), (int) (circleRadius * 2.1), conf);
Canvas canvas = new Canvas(circleBitmap);
circleBitmaps[i] = circleBitmap;
mRenderPaint.setColor(set.getCircleColor(i));
if (drawTransparentCircleHole) {
// Begin path for circle with hole
mCirclePathBuffer.reset();
mCirclePathBuffer.addCircle(
circleRadius,
circleRadius,
circleRadius,
Path.Direction.CW);
// Cut hole in path
mCirclePathBuffer.addCircle(
circleRadius,
circleRadius,
circleHoleRadius,
Path.Direction.CCW);
// Fill in-between
canvas.drawPath(mCirclePathBuffer, mRenderPaint);
} else {
canvas.drawCircle(
circleRadius,
circleRadius,
circleRadius,
mRenderPaint);
if (drawCircleHole) {
canvas.drawCircle(
circleRadius,
circleRadius,
circleHoleRadius,
mCirclePaintInner);
}
}
}
}
/**
* Returns the cached Bitmap at the given index.
*
* @param index
* @return
*/
protected Bitmap getBitmap(int index) {
return circleBitmaps[index % circleBitmaps.length];
}
}
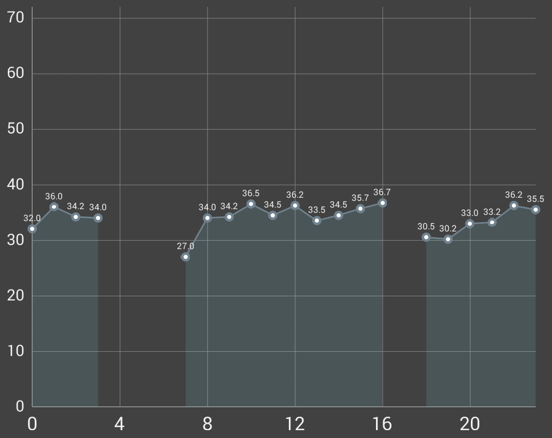
}OK,最后看下效果:
PS.20171023 曲线填充修正效果,之前填充会感觉很奇怪!
收藏的用户(0) X
正在加载信息~
推荐阅读
站点信息
- 文章2322
- 用户1338
- 访客12324359
每日一句
The butterfly's beauty is born from the caterpillar's patience.
蝴蝶的美丽,诞生于毛虫的耐心。
蝴蝶的美丽,诞生于毛虫的耐心。