之前一直用Android开发,曲线则是用到MPAndroidChart,因为项目有需求非连续折线图,后改装了一下安卓的版本。
这次又要弄iOS版本,发现MPAndroidChart的作者居然也开发了一份iOS版本,结构和实现方式基本上相同,于是直接下载下来改装。Charts是基于Swift4.1开发的,我的xcode不支持4.1,在编译的时候报了一个没有成员方法compactMap的错误,直接改成flatMap编译成功。
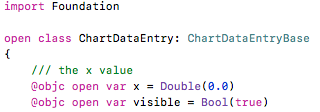
然后在ChartDataEntry类中添加一个bool型变量,和安卓基本上一致,不过iOS操作更简单
然后就是修改LineChartRenderer类,源码如下
//
// LineChartRenderer.swift
// Charts
//
// Copyright 2015 Daniel Cohen Gindi & Philipp Jahoda
// A port of MPAndroidChart for iOS
// Licensed under Apache License 2.0
//
// https://github.com/danielgindi/Charts
//
import Foundation
import CoreGraphics
#if !os(OSX)
import UIKit
#endif
open class LineChartRenderer: LineRadarRenderer
{
@objc open weak var dataProvider: LineChartDataProvider?
@objc public init(dataProvider: LineChartDataProvider, animator: Animator, viewPortHandler: ViewPortHandler)
{
super.init(animator: animator, viewPortHandler: viewPortHandler)
self.dataProvider = dataProvider
}
open override func drawData(context: CGContext)
{
guard let lineData = dataProvider?.lineData else { return }
for i in 0 ..< lineData.dataSetCount
{
guard let set = lineData.getDataSetByIndex(i) else { continue }
if set.isVisible
{
if !(set is ILineChartDataSet)
{
fatalError("Datasets for LineChartRenderer must conform to ILineChartDataSet")
}
drawDataSet(context: context, dataSet: set as! ILineChartDataSet)
}
}
}
@objc open func drawDataSet(context: CGContext, dataSet: ILineChartDataSet)
{
if dataSet.entryCount < 1
{
return
}
context.saveGState()
context.setLineWidth(dataSet.lineWidth)
if dataSet.lineDashLengths != nil
{
context.setLineDash(phase: dataSet.lineDashPhase, lengths: dataSet.lineDashLengths!)
}
else
{
context.setLineDash(phase: 0.0, lengths: [])
}
// if drawing cubic lines is enabled
switch dataSet.mode
{
case .linear: fallthrough
case .stepped:
drawLinear(context: context, dataSet: dataSet)
case .cubicBezier:
drawCubicBezier(context: context, dataSet: dataSet)
case .horizontalBezier:
drawHorizontalBezier(context: context, dataSet: dataSet)
}
context.restoreGState()
}
@objc open func drawCubicBezier(context: CGContext, dataSet: ILineChartDataSet)
{
guard let dataProvider = dataProvider else { return }
let trans = dataProvider.getTransformer(forAxis: dataSet.axisDependency)
let phaseY = animator.phaseY
_xBounds.set(chart: dataProvider, dataSet: dataSet, animator: animator)
// get the color that is specified for this position from the DataSet
let drawingColor = dataSet.colors.first!
let intensity = dataSet.cubicIntensity
// the path for the cubic-spline
let cubicPath = CGMutablePath()
let valueToPixelMatrix = trans.valueToPixelMatrix
if _xBounds.range >= 1
{
var prevDx: CGFloat = 0.0
var prevDy: CGFloat = 0.0
var curDx: CGFloat = 0.0
var curDy: CGFloat = 0.0
// Take an extra point from the left, and an extra from the right.
// That's because we need 4 points for a cubic bezier (cubic=4), otherwise we get lines moving and doing weird stuff on the edges of the chart.
// So in the starting `prev` and `cur`, go -2, -1
// And in the `lastIndex`, add +1
let firstIndex = _xBounds.min + 1
let lastIndex = _xBounds.min + _xBounds.range
var prevPrev: ChartDataEntry! = nil
var prev: ChartDataEntry! = dataSet.entryForIndex(max(firstIndex - 2, 0))
var cur: ChartDataEntry! = dataSet.entryForIndex(max(firstIndex - 1, 0))
var next: ChartDataEntry! = cur
var nextIndex: Int = -1
if cur == nil { return }
// let the spline start
cubicPath.move(to: CGPoint(x: CGFloat(cur.x), y: CGFloat(cur.y * phaseY)), transform: valueToPixelMatrix)
for j in stride(from: firstIndex, through: lastIndex, by: 1)
{
prevPrev = prev
prev = cur
cur = nextIndex == j ? next : dataSet.entryForIndex(j)
nextIndex = j + 1 < dataSet.entryCount ? j + 1 : j
next = dataSet.entryForIndex(nextIndex)
if next == nil { break }
prevDx = CGFloat(cur.x - prevPrev.x) * intensity
prevDy = CGFloat(cur.y - prevPrev.y) * intensity
curDx = CGFloat(next.x - prev.x) * intensity
curDy = CGFloat(next.y - prev.y) * intensity
cubicPath.addCurve(
to: CGPoint(
x: CGFloat(cur.x),
y: CGFloat(cur.y) * CGFloat(phaseY)),
control1: CGPoint(
x: CGFloat(prev.x) + prevDx,
y: (CGFloat(prev.y) + prevDy) * CGFloat(phaseY)),
control2: CGPoint(
x: CGFloat(cur.x) - curDx,
y: (CGFloat(cur.y) - curDy) * CGFloat(phaseY)),
transform: valueToPixelMatrix)
}
}
context.saveGState()
if dataSet.isDrawFilledEnabled
{
// Copy this path because we make changes to it
let fillPath = cubicPath.mutableCopy()
drawCubicFill(context: context, dataSet: dataSet, spline: fillPath!, matrix: valueToPixelMatrix, bounds: _xBounds)
}
context.beginPath()
context.addPath(cubicPath)
context.setStrokeColor(drawingColor.cgColor)
context.strokePath()
context.restoreGState()
}
@objc open func drawHorizontalBezier(context: CGContext, dataSet: ILineChartDataSet)
{
guard let dataProvider = dataProvider else { return }
let trans = dataProvider.getTransformer(forAxis: dataSet.axisDependency)
let phaseY = animator.phaseY
_xBounds.set(chart: dataProvider, dataSet: dataSet, animator: animator)
// get the color that is specified for this position from the DataSet
let drawingColor = dataSet.colors.first!
// the path for the cubic-spline
let cubicPath = CGMutablePath()
let valueToPixelMatrix = trans.valueToPixelMatrix
if _xBounds.range >= 1
{
var prev: ChartDataEntry! = dataSet.entryForIndex(_xBounds.min)
var cur: ChartDataEntry! = prev
if cur == nil { return }
// let the spline start
cubicPath.move(to: CGPoint(x: CGFloat(cur.x), y: CGFloat(cur.y * phaseY)), transform: valueToPixelMatrix)
for j in stride(from: (_xBounds.min + 1), through: _xBounds.range + _xBounds.min, by: 1)
{
prev = cur
cur = dataSet.entryForIndex(j)
let cpx = CGFloat(prev.x + (cur.x - prev.x) / 2.0)
cubicPath.addCurve(
to: CGPoint(
x: CGFloat(cur.x),
y: CGFloat(cur.y * phaseY)),
control1: CGPoint(
x: cpx,
y: CGFloat(prev.y * phaseY)),
control2: CGPoint(
x: cpx,
y: CGFloat(cur.y * phaseY)),
transform: valueToPixelMatrix)
}
}
context.saveGState()
if dataSet.isDrawFilledEnabled
{
// Copy this path because we make changes to it
let fillPath = cubicPath.mutableCopy()
drawCubicFill(context: context, dataSet: dataSet, spline: fillPath!, matrix: valueToPixelMatrix, bounds: _xBounds)
}
context.beginPath()
context.addPath(cubicPath)
context.setStrokeColor(drawingColor.cgColor)
context.strokePath()
context.restoreGState()
}
open func drawCubicFill(
context: CGContext,
dataSet: ILineChartDataSet,
spline: CGMutablePath,
matrix: CGAffineTransform,
bounds: XBounds)
{
guard
let dataProvider = dataProvider
else { return }
if bounds.range <= 0
{
return
}
let fillMin = dataSet.fillFormatter?.getFillLinePosition(dataSet: dataSet, dataProvider: dataProvider) ?? 0.0
var pt1 = CGPoint(x: CGFloat(dataSet.entryForIndex(bounds.min + bounds.range)?.x ?? 0.0), y: fillMin)
var pt2 = CGPoint(x: CGFloat(dataSet.entryForIndex(bounds.min)?.x ?? 0.0), y: fillMin)
pt1 = pt1.applying(matrix)
pt2 = pt2.applying(matrix)
spline.addLine(to: pt1)
spline.addLine(to: pt2)
spline.closeSubpath()
if dataSet.fill != nil
{
drawFilledPath(context: context, path: spline, fill: dataSet.fill!, fillAlpha: dataSet.fillAlpha)
}
else
{
drawFilledPath(context: context, path: spline, fillColor: dataSet.fillColor, fillAlpha: dataSet.fillAlpha)
}
}
private var _lineSegments = [CGPoint](repeating: CGPoint(), count: 2)
@objc open func drawLinear(context: CGContext, dataSet: ILineChartDataSet)
{
guard let dataProvider = dataProvider else { return }
let trans = dataProvider.getTransformer(forAxis: dataSet.axisDependency)
let valueToPixelMatrix = trans.valueToPixelMatrix
let entryCount = dataSet.entryCount
let isDrawSteppedEnabled = dataSet.mode == .stepped
let pointsPerEntryPair = isDrawSteppedEnabled ? 4 : 2
let phaseY = animator.phaseY
_xBounds.set(chart: dataProvider, dataSet: dataSet, animator: animator)
// if drawing filled is enabled
if dataSet.isDrawFilledEnabled && entryCount > 0
{
drawLinearFill(context: context, dataSet: dataSet, trans: trans, bounds: _xBounds)
}
context.saveGState()
context.setLineCap(dataSet.lineCapType)
// more than 1 color
if dataSet.colors.count > 1
{
if _lineSegments.count != pointsPerEntryPair
{
// Allocate once in correct size
_lineSegments = [CGPoint](repeating: CGPoint(), count: pointsPerEntryPair)
}
for j in stride(from: _xBounds.min, through: _xBounds.range + _xBounds.min, by: 1)
{
var e: ChartDataEntry! = dataSet.entryForIndex(j)
if e == nil { continue }
_lineSegments[0].x = CGFloat(e.x)
_lineSegments[0].y = CGFloat(e.y * phaseY)
if j < _xBounds.max
{
e = dataSet.entryForIndex(j + 1)
if e == nil { break }
if isDrawSteppedEnabled
{
_lineSegments[1] = CGPoint(x: CGFloat(e.x), y: _lineSegments[0].y)
_lineSegments[2] = _lineSegments[1]
_lineSegments[3] = CGPoint(x: CGFloat(e.x), y: CGFloat(e.y * phaseY))
}
else
{
_lineSegments[1] = CGPoint(x: CGFloat(e.x), y: CGFloat(e.y * phaseY))
}
}
else
{
_lineSegments[1] = _lineSegments[0]
}
for i in 0..<_lineSegments.count
{
_lineSegments[i] = _lineSegments[i].applying(valueToPixelMatrix)
}
if (!viewPortHandler.isInBoundsRight(_lineSegments[0].x))
{
break
}
// make sure the lines don't do shitty things outside bounds
if !viewPortHandler.isInBoundsLeft(_lineSegments[1].x)
|| (!viewPortHandler.isInBoundsTop(_lineSegments[0].y) && !viewPortHandler.isInBoundsBottom(_lineSegments[1].y))
{
continue
}
// get the color that is set for this line-segment
context.setStrokeColor(dataSet.color(atIndex: j).cgColor)
context.strokeLineSegments(between: _lineSegments)
}
}
else
{ // only one color per dataset
var e1: ChartDataEntry!
var e2: ChartDataEntry!
e1 = dataSet.entryForIndex(_xBounds.min)
if e1 != nil
{
context.beginPath()
var firstPoint = true
var closePath = false
for x in stride(from: _xBounds.min, through: _xBounds.range + _xBounds.min, by: 1)
{
e1 = dataSet.entryForIndex(x == 0 ? 0 : (x - 1))
e2 = dataSet.entryForIndex(x)
if e1 == nil || e2 == nil { continue }
let pt = CGPoint(
x: CGFloat(e1.x),
y: CGFloat(e1.y * phaseY)
).applying(valueToPixelMatrix)
if firstPoint
{
if e1.visible {
context.move(to: pt)
firstPoint = false
}else if e2.visible {
context.move(to: CGPoint(
x: CGFloat(e2.x),
y: CGFloat(e2.y * phaseY)
).applying(valueToPixelMatrix))
}
}
else if e1.visible
{
if closePath {
continue
}else {
context.addLine(to: pt)
}
}
if isDrawSteppedEnabled
{
context.addLine(to: CGPoint(
x: CGFloat(e2.x),
y: CGFloat(e1.y * phaseY)
).applying(valueToPixelMatrix))
}
if e2.visible {
if closePath {
context.move(to: CGPoint(
x: CGFloat(e2.x),
y: CGFloat(e2.y * phaseY)
).applying(valueToPixelMatrix))
closePath = false
}else{
context.addLine(to: CGPoint(
x: CGFloat(e2.x),
y: CGFloat(e2.y * phaseY)
).applying(valueToPixelMatrix))
}
}else {
closePath = true
}
}
if !firstPoint
{
context.setStrokeColor(dataSet.color(atIndex: 0).cgColor)
context.strokePath()
}
}
}
context.restoreGState()
}
open func drawLinearFill(context: CGContext, dataSet: ILineChartDataSet, trans: Transformer, bounds: XBounds)
{
guard let dataProvider = dataProvider else { return }
let filled = generateFilledPath(
dataSet: dataSet,
fillMin: dataSet.fillFormatter?.getFillLinePosition(dataSet: dataSet, dataProvider: dataProvider) ?? 0.0,
bounds: bounds,
matrix: trans.valueToPixelMatrix)
if dataSet.fill != nil
{
drawFilledPath(context: context, path: filled, fill: dataSet.fill!, fillAlpha: dataSet.fillAlpha)
}
else
{
drawFilledPath(context: context, path: filled, fillColor: dataSet.fillColor, fillAlpha: dataSet.fillAlpha)
}
}
/// Generates the path that is used for filled drawing.
private func generateFilledPath(dataSet: ILineChartDataSet, fillMin: CGFloat, bounds: XBounds, matrix: CGAffineTransform) -> CGPath
{
let phaseY = animator.phaseY
let isDrawSteppedEnabled = dataSet.mode == .stepped
let matrix = matrix
var e: ChartDataEntry!
let filled = CGMutablePath()
var drawFirst = false
e = dataSet.entryForIndex(bounds.min)
if e != nil && e.visible
{
drawFirst = true
filled.move(to: CGPoint(x: CGFloat(e.x), y: fillMin), transform: matrix)
filled.addLine(to: CGPoint(x: CGFloat(e.x), y: CGFloat(e.y * phaseY)), transform: matrix)
}
var currentEntry :ChartDataEntry!
var previousEntry :ChartDataEntry!
previousEntry = e
var closed = false
// create a new path
for x in stride(from: (bounds.min + 1), through: bounds.range + bounds.min, by: 1)
{
guard let e = dataSet.entryForIndex(x) else { continue }
currentEntry = e
if(!currentEntry.visible) {
if(closed || !drawFirst){continue}
filled.addLine(to: CGPoint(x: CGFloat(previousEntry.x), y: fillMin), transform: matrix)
filled.closeSubpath()
closed = true
continue
}
else if(closed) {
closed = false
filled.move(to: CGPoint(x: CGFloat(currentEntry.x), y: fillMin), transform: matrix)
}
if isDrawSteppedEnabled
{
guard let ePrev = dataSet.entryForIndex(x-1) else { continue }
filled.addLine(to: CGPoint(x: CGFloat(e.x), y: CGFloat(ePrev.y * phaseY)), transform: matrix)
}
if drawFirst {
filled.addLine(to: CGPoint(x: CGFloat(e.x), y: CGFloat(e.y * phaseY)), transform: matrix)
}else{
drawFirst = true
filled.move(to: CGPoint(x: CGFloat(e.x), y: fillMin), transform: matrix)
filled.addLine(to: CGPoint(x: CGFloat(e.x), y: CGFloat(e.y * phaseY)), transform: matrix)
}
previousEntry = currentEntry
}
// close up
e = dataSet.entryForIndex(bounds.range + bounds.min)
if e != nil && e.visible
{
filled.addLine(to: CGPoint(x: CGFloat(e.x), y: fillMin), transform: matrix)
}
if drawFirst {
filled.closeSubpath()
}
return filled
}
open override func drawValues(context: CGContext)
{
guard
let dataProvider = dataProvider,
let lineData = dataProvider.lineData
else { return }
if isDrawingValuesAllowed(dataProvider: dataProvider)
{
var dataSets = lineData.dataSets
let phaseY = animator.phaseY
var pt = CGPoint()
for i in 0 ..< dataSets.count
{
guard let dataSet = dataSets[i] as? ILineChartDataSet else { continue }
if !shouldDrawValues(forDataSet: dataSet)
{
continue
}
let valueFont = dataSet.valueFont
guard let formatter = dataSet.valueFormatter else { continue }
let trans = dataProvider.getTransformer(forAxis: dataSet.axisDependency)
let valueToPixelMatrix = trans.valueToPixelMatrix
let iconsOffset = dataSet.iconsOffset
// make sure the values do not interfear with the circles
var valOffset = Int(dataSet.circleRadius * 1.75)
if !dataSet.isDrawCirclesEnabled
{
valOffset = valOffset / 2
}
_xBounds.set(chart: dataProvider, dataSet: dataSet, animator: animator)
for j in stride(from: _xBounds.min, through: min(_xBounds.min + _xBounds.range, _xBounds.max), by: 1)
{
guard let e = dataSet.entryForIndex(j) else { break }
if !e.visible {continue}
pt.x = CGFloat(e.x)
pt.y = CGFloat(e.y * phaseY)
pt = pt.applying(valueToPixelMatrix)
if (!viewPortHandler.isInBoundsRight(pt.x))
{
break
}
if (!viewPortHandler.isInBoundsLeft(pt.x) || !viewPortHandler.isInBoundsY(pt.y))
{
continue
}
if dataSet.isDrawValuesEnabled {
ChartUtils.drawText(
context: context,
text: formatter.stringForValue(
e.y,
entry: e,
dataSetIndex: i,
viewPortHandler: viewPortHandler),
point: CGPoint(
x: pt.x,
y: pt.y - CGFloat(valOffset) - valueFont.lineHeight),
align: .center,
attributes: [NSAttributedStringKey.font: valueFont, NSAttributedStringKey.foregroundColor: dataSet.valueTextColorAt(j)])
}
if let icon = e.icon, dataSet.isDrawIconsEnabled
{
ChartUtils.drawImage(context: context,
image: icon,
x: pt.x + iconsOffset.x,
y: pt.y + iconsOffset.y,
size: icon.size)
}
}
}
}
}
open override func drawExtras(context: CGContext)
{
drawCircles(context: context)
}
private func drawCircles(context: CGContext)
{
guard
let dataProvider = dataProvider,
let lineData = dataProvider.lineData
else { return }
let phaseY = animator.phaseY
let dataSets = lineData.dataSets
var pt = CGPoint()
var rect = CGRect()
context.saveGState()
for i in 0 ..< dataSets.count
{
guard let dataSet = lineData.getDataSetByIndex(i) as? ILineChartDataSet else { continue }
if !dataSet.isVisible || !dataSet.isDrawCirclesEnabled || dataSet.entryCount == 0
{
continue
}
let trans = dataProvider.getTransformer(forAxis: dataSet.axisDependency)
let valueToPixelMatrix = trans.valueToPixelMatrix
_xBounds.set(chart: dataProvider, dataSet: dataSet, animator: animator)
let circleRadius = dataSet.circleRadius
let circleDiameter = circleRadius * 2.0
let circleHoleRadius = dataSet.circleHoleRadius
let circleHoleDiameter = circleHoleRadius * 2.0
let drawCircleHole = dataSet.isDrawCircleHoleEnabled &&
circleHoleRadius < circleRadius &&
circleHoleRadius > 0.0
let drawTransparentCircleHole = drawCircleHole &&
(dataSet.circleHoleColor == nil ||
dataSet.circleHoleColor == NSUIColor.clear)
for j in stride(from: _xBounds.min, through: _xBounds.range + _xBounds.min, by: 1)
{
guard let e = dataSet.entryForIndex(j) else { break }
if !e.visible{continue}
pt.x = CGFloat(e.x)
pt.y = CGFloat(e.y * phaseY)
pt = pt.applying(valueToPixelMatrix)
if (!viewPortHandler.isInBoundsRight(pt.x))
{
break
}
// make sure the circles don't do shitty things outside bounds
if (!viewPortHandler.isInBoundsLeft(pt.x) || !viewPortHandler.isInBoundsY(pt.y))
{
continue
}
context.setFillColor(dataSet.getCircleColor(atIndex: j)!.cgColor)
rect.origin.x = pt.x - circleRadius
rect.origin.y = pt.y - circleRadius
rect.size.width = circleDiameter
rect.size.height = circleDiameter
if drawTransparentCircleHole
{
// Begin path for circle with hole
context.beginPath()
context.addEllipse(in: rect)
// Cut hole in path
rect.origin.x = pt.x - circleHoleRadius
rect.origin.y = pt.y - circleHoleRadius
rect.size.width = circleHoleDiameter
rect.size.height = circleHoleDiameter
context.addEllipse(in: rect)
// Fill in-between
context.fillPath(using: .evenOdd)
}
else
{
context.fillEllipse(in: rect)
if drawCircleHole
{
context.setFillColor(dataSet.circleHoleColor!.cgColor)
// The hole rect
rect.origin.x = pt.x - circleHoleRadius
rect.origin.y = pt.y - circleHoleRadius
rect.size.width = circleHoleDiameter
rect.size.height = circleHoleDiameter
context.fillEllipse(in: rect)
}
}
}
}
context.restoreGState()
}
open override func drawHighlighted(context: CGContext, indices: [Highlight])
{
guard
let dataProvider = dataProvider,
let lineData = dataProvider.lineData
else { return }
let chartXMax = dataProvider.chartXMax
context.saveGState()
for high in indices
{
guard let set = lineData.getDataSetByIndex(high.dataSetIndex) as? ILineChartDataSet
, set.isHighlightEnabled
else { continue }
guard let e = set.entryForXValue(high.x, closestToY: high.y) else { continue }
if !isInBoundsX(entry: e, dataSet: set)
{
continue
}
context.setStrokeColor(set.highlightColor.cgColor)
context.setLineWidth(set.highlightLineWidth)
if set.highlightLineDashLengths != nil
{
context.setLineDash(phase: set.highlightLineDashPhase, lengths: set.highlightLineDashLengths!)
}
else
{
context.setLineDash(phase: 0.0, lengths: [])
}
let x = high.x // get the x-position
let y = high.y * Double(animator.phaseY)
if x > chartXMax * animator.phaseX
{
continue
}
let trans = dataProvider.getTransformer(forAxis: set.axisDependency)
let pt = trans.pixelForValues(x: x, y: y)
high.setDraw(pt: pt)
// draw the lines
drawHighlightLines(context: context, point: pt, set: set)
}
context.restoreGState()
}
}使用代码片
NSMutableArray *values = [[NSMutableArray alloc] init]
for (int i = 0; i < 20; i++){
double val = arc4random_uniform(100) + 3;
ChartDataEntry* entry = [[ChartDataEntry alloc] initWithX:i y:val];
if((i >= 0 && i <= 3) || (i >= 7 && i <= 8))[entry setVisible:NO];
[values addObject:entry];
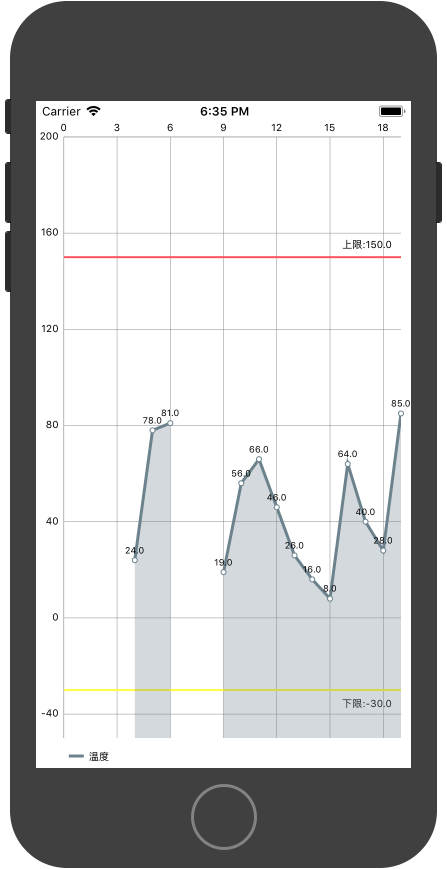
}效果图
收藏的用户(0) X
正在加载信息~
推荐阅读
最新回复 (1)
-

//
//  ViewController.m
//  ChartDemo
//
//  Created by --on 2018/5/15.
//  Copyright © 2018年 wbee. All rights reserved.
//
#import "ViewController.h"
#import "Charts-Bridging.h"
#define rgbColor(r,g,b)     [UIColor colorWithRed:r/255.f green:g/255.f blue:b/255.f alpha:1.0f]
#define rgbaColor(r,g,b,a)  [UIColor colorWithRed:r/255.f green:g/255.f blue:b/255.f alpha:a]
#define colorRGB(color) [UIColor colorWithRed:((color>>16)&0xFF)/255.f green:((color>>8)&0xFF)/255.f blue:((color&0xFF))/255.f alpha:1.0f]
@interface ViewController ()<ChartViewDelegate>
@property (weak, nonatomic) IBOutlet LineChartView *chartView;
@end
@implementation ViewController
- (void)viewDidLoad {
    [super viewDidLoad];
    // Do any additional setup after loading the view, typically from a nib.
    _chartView.delegate = self;

    _chartView.chartDescription.enabled = NO;

    _chartView.dragEnabled = YES;
    [_chartView setScaleEnabled:YES];
    _chartView.pinchZoomEnabled = YES;

    [_chartView setBackgroundColor:colorRGB(0x66515151)];

    NSMutableArray *values = [[NSMutableArray alloc] init];

    double max = -999999,min = 999999;
    for (int i = 0; i < 20; i++){
        double val = arc4random_uniform(100) + 100;
        NSLog(@"%d",(int)val);
        ChartDataEntry* entry = [[ChartDataEntry alloc] initWithX:i y:val];
        if((i >= 7 && i <= 8)){
            [entry setVisible:NO];
        }else{
            if(val > max) max = val;
            if(val < min) min = val;
        }
        [values addObject:entry];
    }

    ChartXAxis *xAxis = _chartView.xAxis;
    xAxis.labelPosition = XAxisLabelPositionBottom;
    xAxis.labelTextColor = [UIColor whiteColor];
    xAxis.drawGridLinesEnabled = NO;

    ChartYAxis *leftAxis = _chartView.leftAxis;
    leftAxis.axisMaximum = (int)max << 1;
    leftAxis.axisMinimum = (int)min >> 1;

    ChartLimitLine *ll1 = [[ChartLimitLine alloc] initWithLimit:max+10 label:[NSString stringWithFormat:@"上限:%.1f",max+10]];
    ll1.labelPosition = ChartLimitLabelPositionRightTop;
    ll1.valueFont = [UIFont boldSystemFontOfSize:12.f];
    //ll1.lineColor = colorRGB(0xFF0000);
    ll1.valueTextColor = colorRGB(0xFF0000);

    ChartLimitLine *ll2 = [[ChartLimitLine alloc] initWithLimit:min-10 label:[NSString stringWithFormat:@"下限:%.1f",min-10]];
    ll2.labelPosition = ChartLimitLabelPositionRightBottom;
    ll2.valueFont = [UIFont boldSystemFontOfSize:12.f];
    ll2.lineColor = colorRGB(0xFFFF00);
    ll2.valueTextColor = colorRGB(0xFFFF00);

    [leftAxis removeAllLimitLines];
    [leftAxis addLimitLine:ll1];
    [leftAxis addLimitLine:ll2];
    leftAxis.drawZeroLineEnabled = NO;
    leftAxis.drawLimitLinesBehindDataEnabled = YES;
    leftAxis.labelTextColor = [UIColor whiteColor];

    _chartView.rightAxis.enabled = NO;

    ChartLegend *l = _chartView.legend;
    l.form = ChartLegendFormCircle;
    l.textColor = UIColor.whiteColor;
    l.horizontalAlignment = ChartLegendHorizontalAlignmentRight;
    l.verticalAlignment = ChartLegendVerticalAlignmentTop;
    l.orientation = ChartLegendOrientationHorizontal;
    l.drawInside = NO;

    NSArray* labels = [NSArray arrayWithObjects:@"数值", nil];
    NSMutableArray* entries = [[NSMutableArray alloc]initWithCapacity:labels.count];
    for(NSString* text in labels) {
        ChartLegendEntry* en = [[ChartLegendEntry alloc]init];
        en.label = text;
        en.formColor = colorRGB(0x70828e);
        [entries addObject:en];
    }
    [_chartView.legend setCustomWithEntries:entries];
    //[_chartView animateWithXAxisDuration:2.5];

    LineChartDataSet* set = [[LineChartDataSet alloc] initWithValues:values];
    [set setColor:[UIColor whiteColor]];
    [set setCircleColor:colorRGB(0x70828e)];
    set.lineWidth = 1.0;
    set.circleRadius = 3.0;
    set.drawCircleHoleEnabled = YES;
    set.circleHoleColor = [UIColor whiteColor];
    set.circleHoleRadius = 2.0;
    set.formSize = 15.0;
    set.valueFont = [UIFont systemFontOfSize:9.f];
    set.valueTextColor = [UIColor whiteColor];
    //设置渐变填充
    [set setFillColor:colorRGB(0x70828e)];
    [set setFillAlpha:0.3f];
    [set setDrawFilledEnabled:YES];

    NSMutableArray *dataSets = [[NSMutableArray alloc] init];//可以添加多条曲线
    [dataSets addObject:set];

    _chartView.data = [[LineChartData alloc] initWithDataSets:dataSets];
}
- (void)didReceiveMemoryWarning {
    [super didReceiveMemoryWarning];
    // Dispose of any resources that can be recreated.
}
@end
站点信息
- 文章2321
- 用户1336
- 访客12206439
每日一句
Cherry blossoms blush before they bloom.
樱花在盛开前先红了脸颊。
樱花在盛开前先红了脸颊。