给大家介绍一个好用的数据图开源库:iOS-Charts,github链接https://github.com/danielgindi/Charts,这个开源库是用Swift实现的,Android也有他写的相应开源库:MPAndroidChart(笔者在Android的app中一直使用该库,功能强大还好用)。
使用条件:
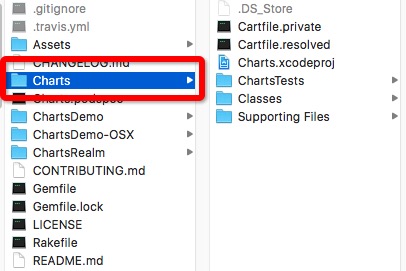
下载完成解压后主要使用charts文件夹:
配置步骤:
1、首先新建一个项目(我这里把工程命名为ChartsTest),把之前下载好的Charts文件夹拖到工程主目录下。
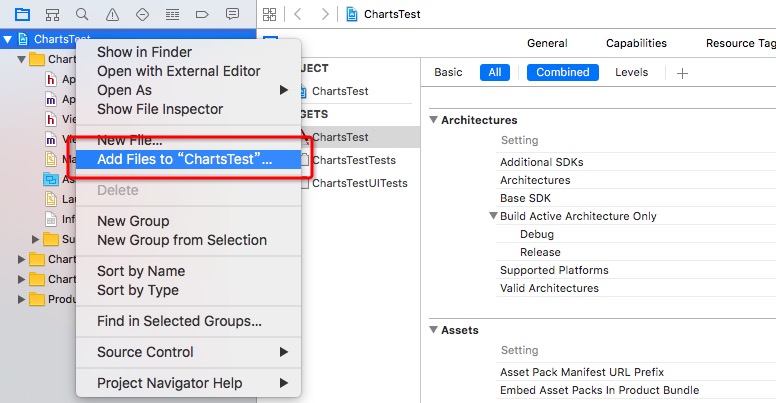
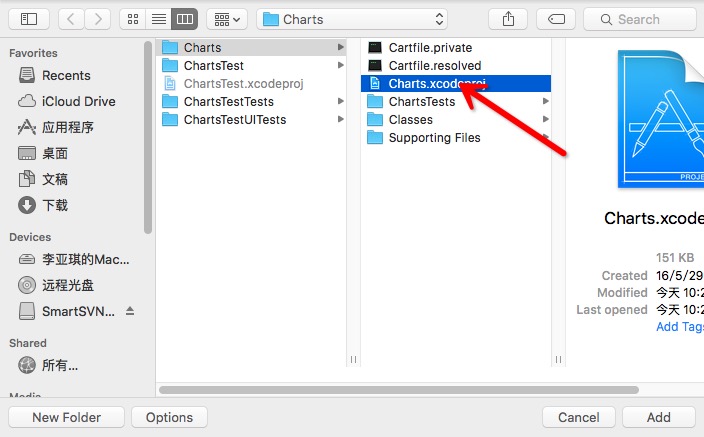
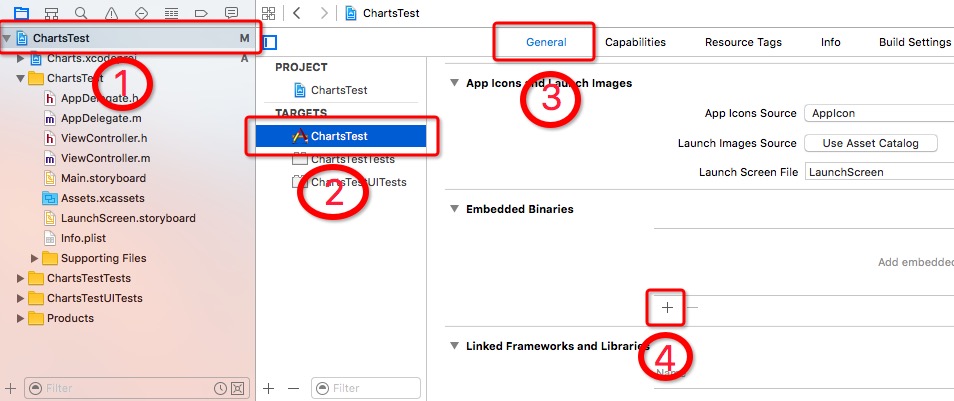
2、右击项目,选择-》Add Files to”xx”,在弹出的选择文件框中选择”Charts.xcodeproj”(注意:不要选择文件夹)。
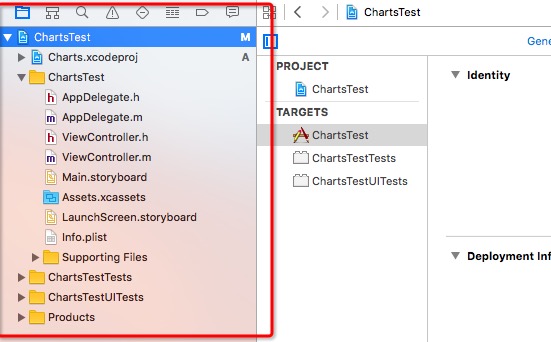
现在项目变成了这个样子
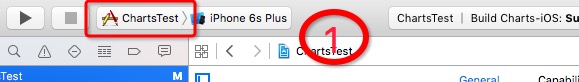
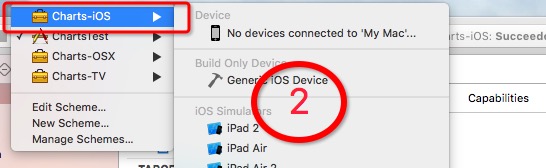
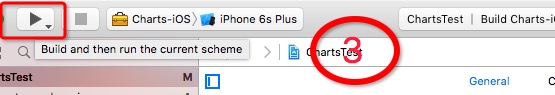
3、编译Charts-ios。
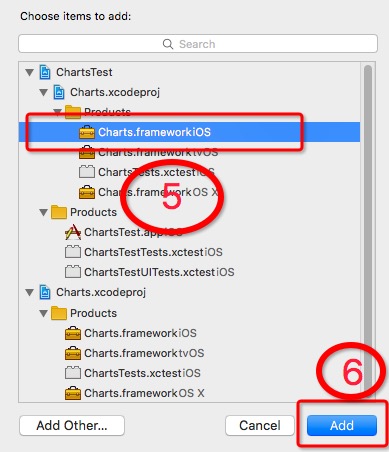
4、添加Charts.framework到项目中。
5、创建用于oc和swift混编的桥接文件(*.h文件)(我这里命名为:Charts-Bridging.h),并在桥接文件里面导入Charts。
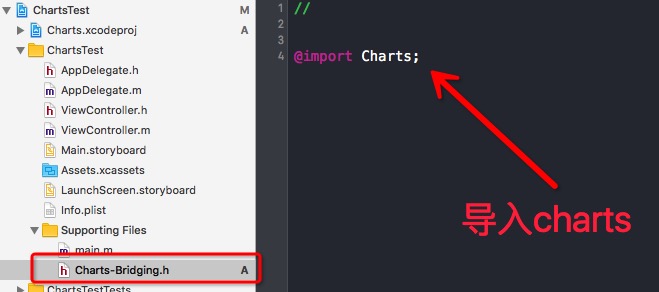
当然建立这个桥接文件也有一个便利的方法,就是直接在项目中新建一个(*.swift)的文件,系统会弹出提示询问你是否要新建桥接文件,选择创建就行了。这里我就不做截图了有兴趣的自己去试一下。
6、桥接文件和开启混编配置。
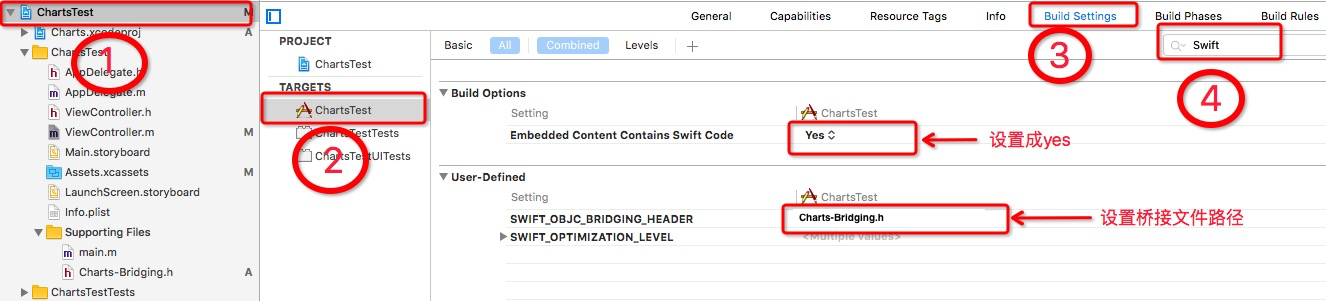
到此为止我们的配置就完成了,接下来我说一下在项目使用图表控件。
使用步骤:
1、在ViewController中导入下面两个文件。
#import "Charts-Bridging.h"
#import "ChartsTest-Swift.h"
2、在ViewController中添加如下代码。
//
//  ViewController.m
//  ChartDemo
//
//  Created by MrLee on 2018/5/15.
//  Copyright © 2018年 wbee. All rights reserved.
//
#import "ViewController.h"
#import "Charts-Bridging.h"
#define rgbColor(r,g,b)     [UIColor colorWithRed:r/255.f green:g/255.f blue:b/255.f alpha:1.0f]
#define rgbaColor(r,g,b,a)  [UIColor colorWithRed:r/255.f green:g/255.f blue:b/255.f alpha:a]
#define colorRGB(color) [UIColor colorWithRed:((color>>16)&0xFF)/255.f green:((color>>8)&0xFF)/255.f blue:((color&0xFF))/255.f alpha:1.0f]
@interface ViewController ()<ChartViewDelegate>
@property (weak, nonatomic) IBOutlet LineChartView *chartView;
@end
@implementation ViewController
- (void)viewDidLoad {
    [super viewDidLoad];
    // Do any additional setup after loading the view, typically from a nib.
    _chartView.delegate = self;

    _chartView.chartDescription.enabled = NO;

    _chartView.dragEnabled = YES;
    [_chartView setScaleEnabled:YES];
    _chartView.pinchZoomEnabled = YES;
    _chartView.drawGridBackgroundEnabled = NO;

    // x-axis limit line
    ChartLimitLine *llXAxis = [[ChartLimitLine alloc] initWithLimit:10.0 label:@"X坐标"];
    llXAxis.lineWidth = 4.0;
    llXAxis.labelPosition = ChartLimitLabelPositionRightBottom;
    llXAxis.valueFont = [UIFont systemFontOfSize:10.f];

    //[_chartView.xAxis addLimitLine:llXAxis];

    _chartView.xAxis.gridLineDashPhase = 0.f;

    ChartLimitLine *ll1 = [[ChartLimitLine alloc] initWithLimit:150.0 label:@"上限"];
    ll1.labelPosition = ChartLimitLabelPositionRightTop;
    ll1.valueFont = [UIFont systemFontOfSize:10.0];

    ChartLimitLine *ll2 = [[ChartLimitLine alloc] initWithLimit:-30.0 label:@"下限"];
    ll2.labelPosition = ChartLimitLabelPositionRightBottom;
    ll2.valueFont = [UIFont systemFontOfSize:10.0];
    ll2.lineColor = colorRGB(0xFFFF00);

    ChartYAxis *leftAxis = _chartView.leftAxis;
    [leftAxis removeAllLimitLines];
    [leftAxis addLimitLine:ll1];
    [leftAxis addLimitLine:ll2];
    leftAxis.axisMaximum = 200.0;
    leftAxis.axisMinimum = -50.0;
    leftAxis.drawZeroLineEnabled = NO;
    leftAxis.drawLimitLinesBehindDataEnabled = YES;

    _chartView.rightAxis.enabled = NO;

    //[_chartView.viewPortHandler setMaximumScaleY: 2.f];
    //[_chartView.viewPortHandler setMaximumScaleX: 2.f];

    _chartView.legend.form = ChartLegendFormLine;
    [_chartView animateWithXAxisDuration:2.5];

    NSMutableArray *values = [[NSMutableArray alloc] init];

    for (int i = 0; i < 10; i++){
        double val = arc4random_uniform(100) + 3;
        [values addObject:[[ChartDataEntry alloc] initWithX:i y:val]];
    }

    LineChartDataSet* set1 = [[LineChartDataSet alloc] initWithValues:values label:@"温度"];

    [set1 setColor:colorRGB(0x70828e)];
    [set1 setCircleColor:colorRGB(0x70828e)];
    set1.lineWidth = 3.0;
    set1.circleRadius = 3.0;
    set1.drawCircleHoleEnabled = YES;
    set1.circleHoleColor = [UIColor whiteColor];
    set1.circleHoleRadius = 2.0;
    set1.valueFont = [UIFont systemFontOfSize:9.f];
    set1.formSize = 15.0;

    [set1 setFillColor:colorRGB(0x70828e)];
    [set1 setFillAlpha:0.3f];
    set1.drawFilledEnabled = YES;

    NSMutableArray *dataSets = [[NSMutableArray alloc] init];//可以添加多条曲线
    [dataSets addObject:set1];

    _chartView.data = [[LineChartData alloc] initWithDataSets:dataSets];

//    [_chartView.data notifyDataChanged];
//    [_chartView notifyDataSetChanged];
}
- (void)didReceiveMemoryWarning {
    [super didReceiveMemoryWarning];
    // Dispose of any resources that can be recreated.
}
@end
3、编译运行

最新库的Demo代码
本文链接:https://www.it72.com/12368.htm
 iOS路径剪切和蒙版
 T9社区注册方法【勼适様鲃女尔懟死】
 Android Studio创建进程通信简单例子
 Win10定时执行php任务
 注册表监控驱动代码
 Python下载文件的简单示例
 【教程】手把手教你开通淘小铺赚佣金
 Win10+cocos2d-x-3.17.2+VS2017环境搭建
 Run-Time Check Failure #0 - The value of ESP was not properly saved across a function call. This is
 Android最简单方式实现DatePickerDialog只显示年、月、日
 Android Studio3.0快速生成JNI头文件
 纯C++实现的HTTP请求
 windows10 1809关闭烦人的自动更新